Profitable Areas Identification


Hi, my name is Ashutosh. I am a recent Business Analytics Graduate Student at the University of Cincinnati developing a versatile set of technical and analytical skills in the field of Data Science. I have over 2 years of experience working in domains like Healthcare and Insurance with expertise in developing analytical solutions for end-users, building predictive models, creating dashboards and reports for tracking KPIs, and collaborating with other business teams for product improvements. I have strong expertise in tools like Python, R, MS SQL Server,Tableau, Java, JavaScript, Excel. With keen analytical abilities, I find myself highly interested in the field of Business Analytics and wish to delve deeper into this field in my next job role.

Ameritas
Data Science Student Consultant - -
Partnered with the Customer Experience (CX) team of Ameritas to improve customer retention for their Index Universal Life (IUL) insurance product

Napier Healthcare
Software Engineer, Healthcare Analytics - -
Worked for 2 Healthcare solution products building dashboards and reports for end-users, using data to drive clinical solutions, identifying KPIs and implementing new features to make user experience better
Profitable Areas Identification
Image Classification

Stock Prices Forecasting

My Phone Activity
Sentiment Analysis

PL Table Predictions

Click-Through Prediction

Cost Minimization

The Movie Dashboard

University of Cincinnati
MS in Business Analytics - -
Indian Institute of Technology Patna
B.Tech in Chemical Science & Technology- -
Profitable Areas Identification in NYC
Carried out EDA and performed feature engineering on the Airbnb and Zillow data to identify the most profitable zip codes for short-term rental investments in NYC. The properties were evaluated on a number of metrics - Payback Period, ROI etc.
The link for this project can be found here
Image Classification
Performed classification of 60,000+ images of 10 different objects using models like 3-layered CNN, VGG-16, Gradient Boosting, SVM, Logistic and compared their performance.
The link for this project can be found here
S&P 500 Time Series Forecasting
Built a RShiny application displaying the forecasted prices of stock indexes like Amazon, Google etc. by using ARIMA method on historical stock prices data (S&P 500).
The link for the application can be found here
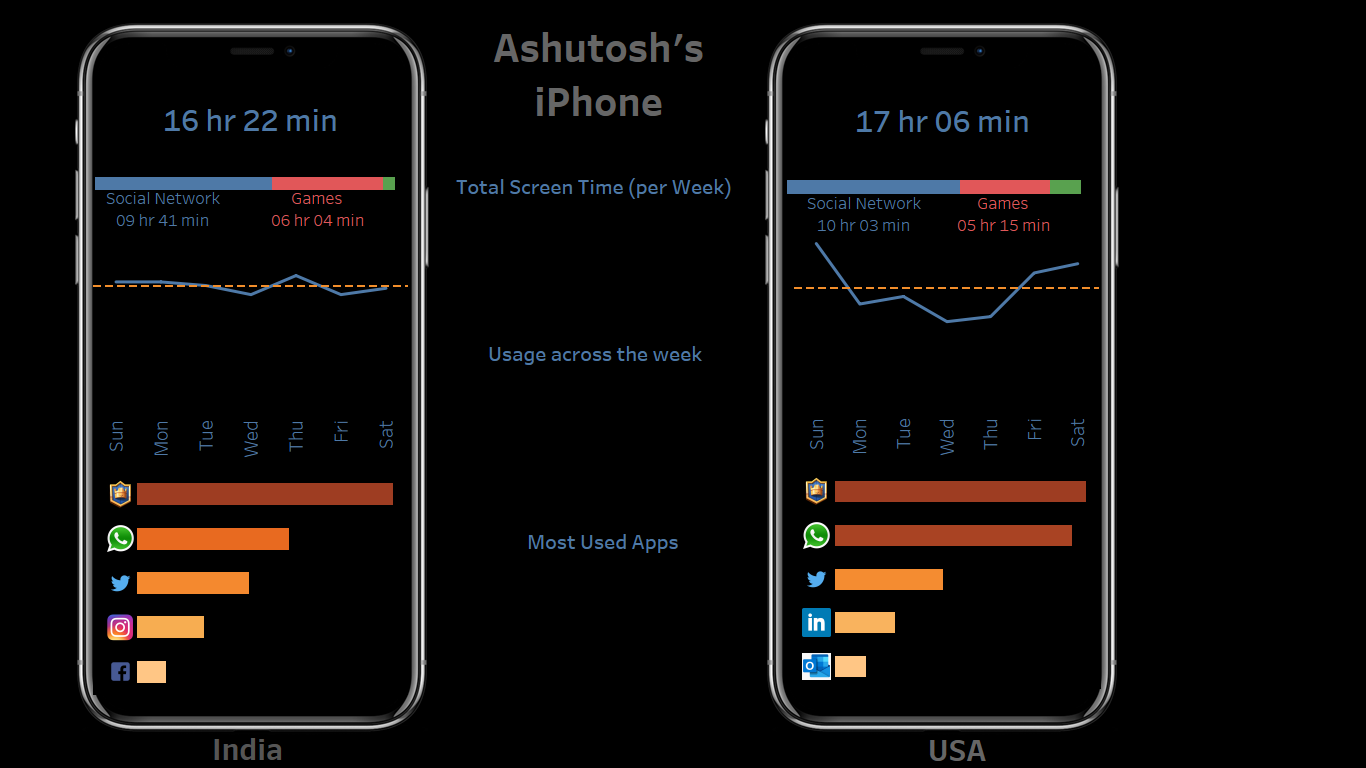
My Phone Screen Time Comparison
A Tableau Dashboard showing Weekly comparison of my mobile screen time since I have moved from India to the US for studies.
The link for this project can be found here
Sentiment Analysis on Twitter
Analyze the sentiment (postive, negative or neutral) on a particular Twitter topic based on the latest 100 tweets retrieved for that topic.
The link for this project can be found here
PL 2019/20 Table Predictions
A Monte Carlo Simulation of all the possible fixture results for the 2019/20 season based on the statistics from 2018/19 Premier League season. The final league table was calculated by summing up the expected points for each team.
The link for this project can be found here
Click-Through Prediction in Online Hotel Searches
Predicting Click-Through in online hotel search results (source: Expedia) using Traditional, Naive Bayes and Neural Network models and comparing these models performance in terms of correct classification.
The link for this project can be found here
Cost Minimization of a Truck-Drone Delivery System
Formulated Mixed Integer Programming (MIP) algorithm to achieve the minimum cost associated with a Truck-Drone Delivery system for a given set of locations using Xpress-MP
The link for this project can be found here
The Movie Dashboard (TMDB 5000 Movies)
Created Tableau dashboard displaying most famous movies in each era (from 1970s to 2010s). The movies were ranked on the basis of revenue, popularity and ratings.
The link for this project can be found here